What is it?
This chart displays the daily variation of your active work. It helps you identify patterns of when work items arrive on your board or when they are completed.
Before reading this tutorial, it is recommended that you read the tutorial about the daily historical WIP chart.
Part 1 – Anatomy of the chart
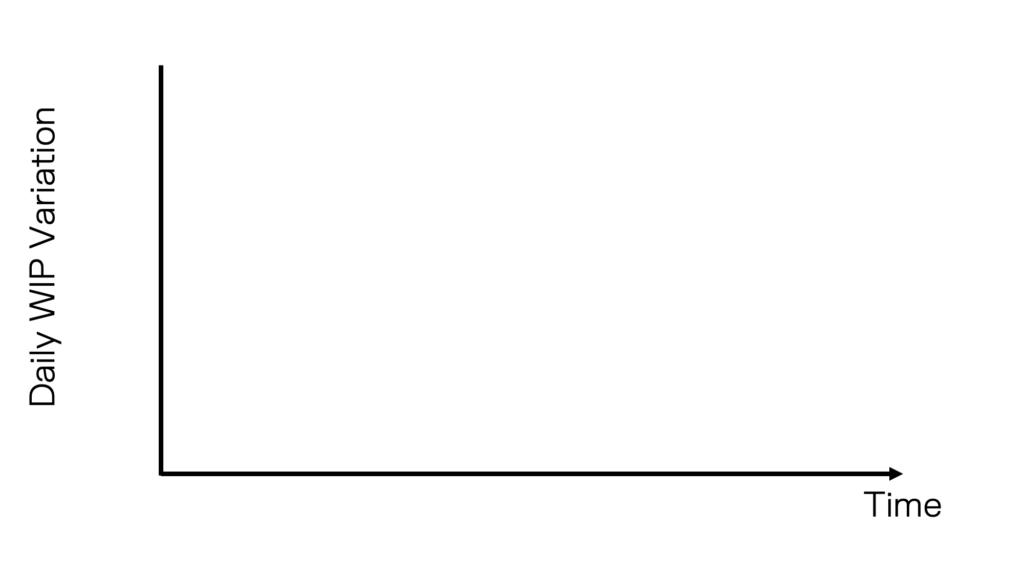
The daily WIP variation chart is a two-dimensional chart with an X-axis and a Y-axis.
The chart’s X-axis contains the period on which we want to plot our daily work in progress variation. The X-axis of the chart always covers a period set in the past. It is always in days. The chart’s Y-axis shows the daily WIP variation, meaning it represents a number of work items.
Visually, an empty daily WIP variation chart plot looks like this:
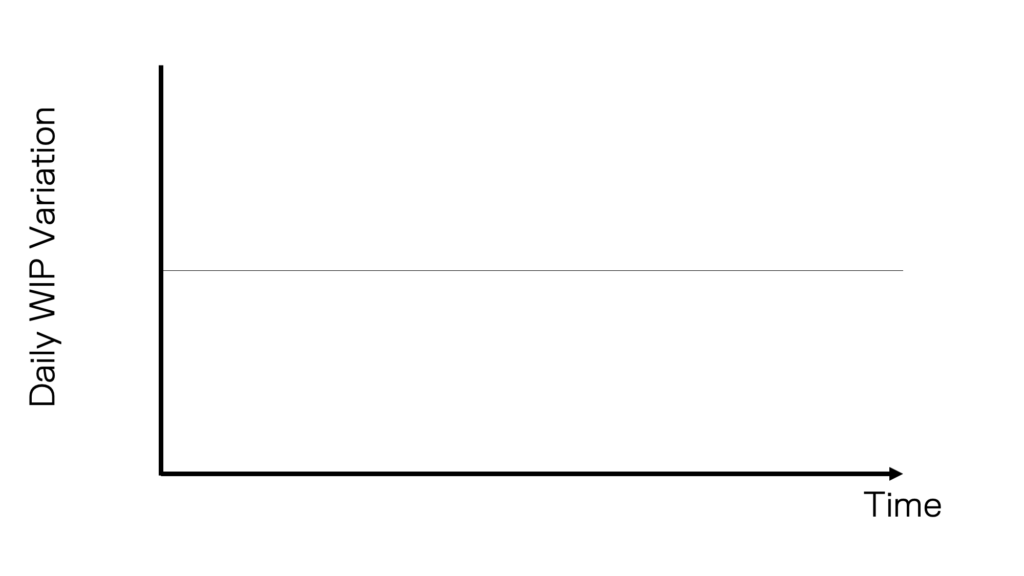
To display the daily variation of arrived and completed work items, a central horizontal line is drawn in the middle of the Y-axis. Arrived (or added) work items will be displayed above this central line. Departed (or completed) work items are displayed below. The following image shows this line.
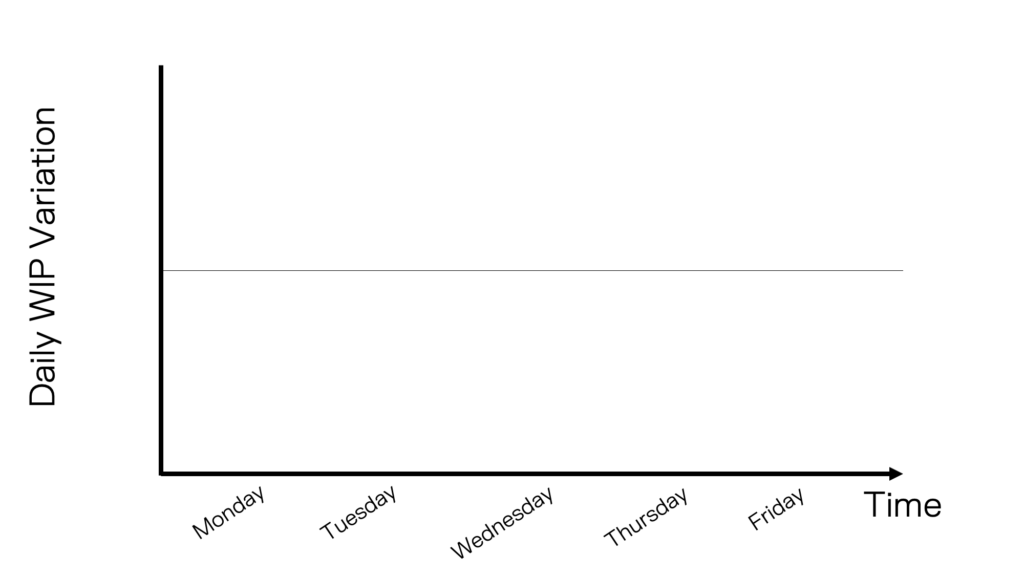
Our next step is to add days on the X-axis. Let’s say we are on Friday and we want to see the variation of WIP for the last 5 days. Visually, our chart looks like this.
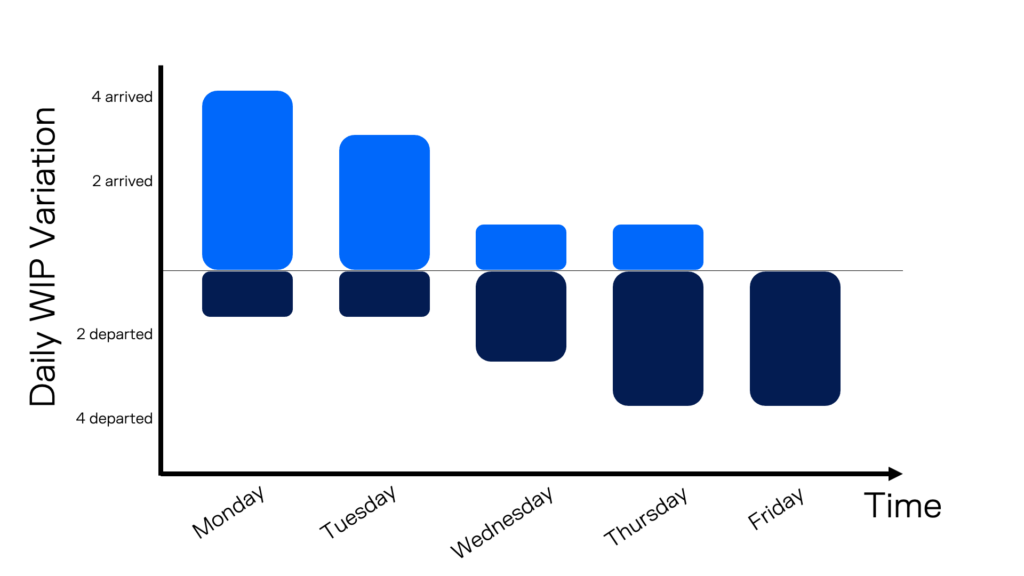
It is now time to add the number of arrived and completed work items on each day. Here is the daily WIP variation in a grid format:
| Day | Arrived work items | Departed work items |
| Monday | 4 | 1 |
| Tuesday | 3 | 1 |
| Wednesday | 1 | 2 |
| Thursday | 1 | 3 |
| Friday | 0 | 3 |
As it may be cumbersome to read this data from a grid, the WIP delta chart offers a powerful way to visualize this data. To represent these daily variations, they will be displayed as bars on the chart. The arrived work items will be above the central line, and the completed work items will be under it.
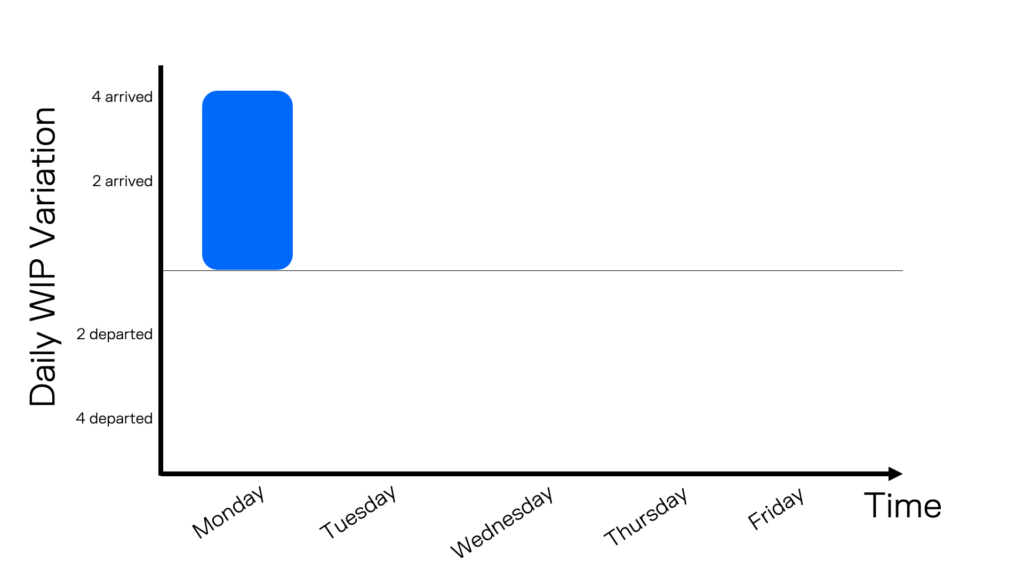
Let’s start by adding the arrived work items on Monday. In the following image, this is shown by the blue bar. It is added above the central line to indicate that new work items were added to the board. Its height is 4 to show 4 work items were added on this day.
Next, we add the number of departed work items from the board on Monday. In the following image, a light blue bar is added under the central line on Monday. It means 1 work item was completed.
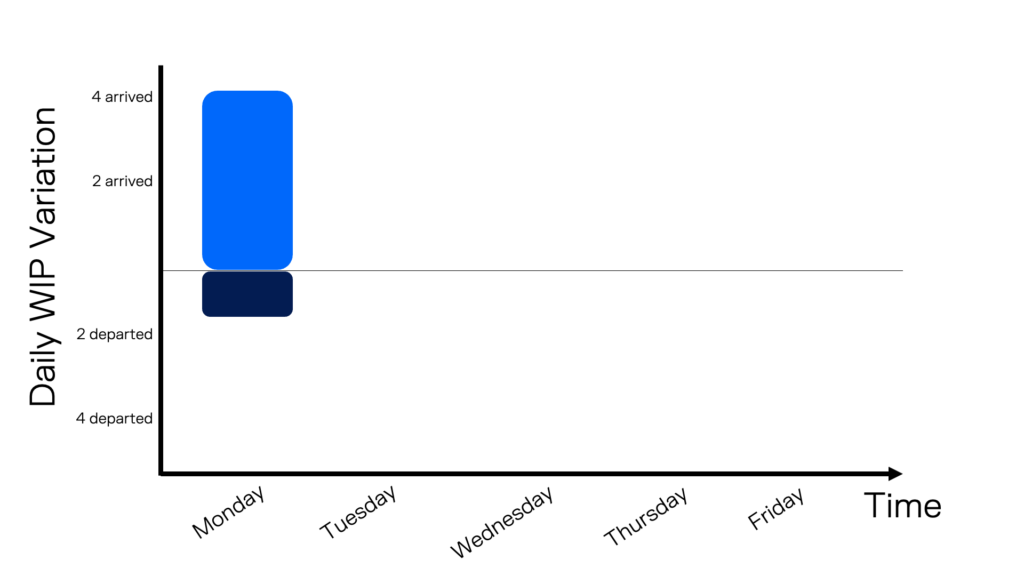
Finally, we add the rest of the added and completed work items for each day on the chart. Here is the final daily WIP variation for our data set.
Part 2 – What value do you get from this chart?
While the daily historical WIP chart shows the overall trend of your active work, it doesn’t show the daily variation. This chart gives an additional level of analysis on how work comes in and out of your process.
An easy and recurring pattern is the month before the Holiday season in North America. The following chart shows the 4 weeks before the Holiday season in December. We can see that the number of new work items is much lower than the number of completed work items.
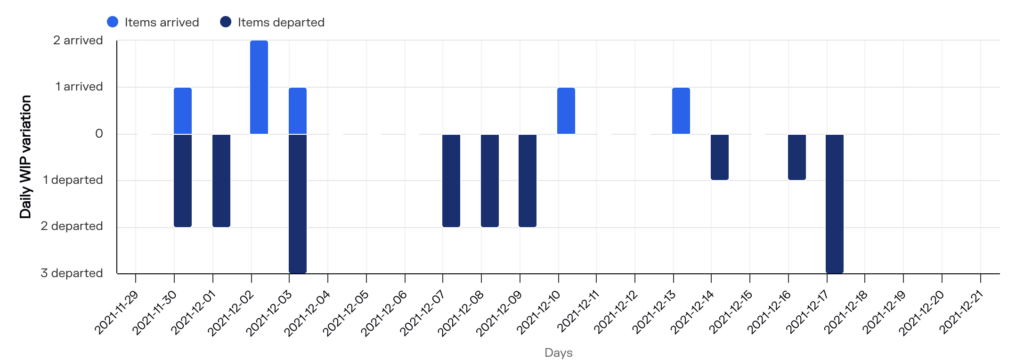
During the period on the chart above, 6 work items arrived and 18 departed.
In the following chart, the daily WIP variation shows 90+ items were added on February 13 and 14. Then, for the next 3 months, a few items depart every week. The data from this chart comes from an organization using SAFe as their ways of working. This a large bunch of work was planned on February 13 and 14, and for the next 3 months, the teams executed on completing this big batch of work.
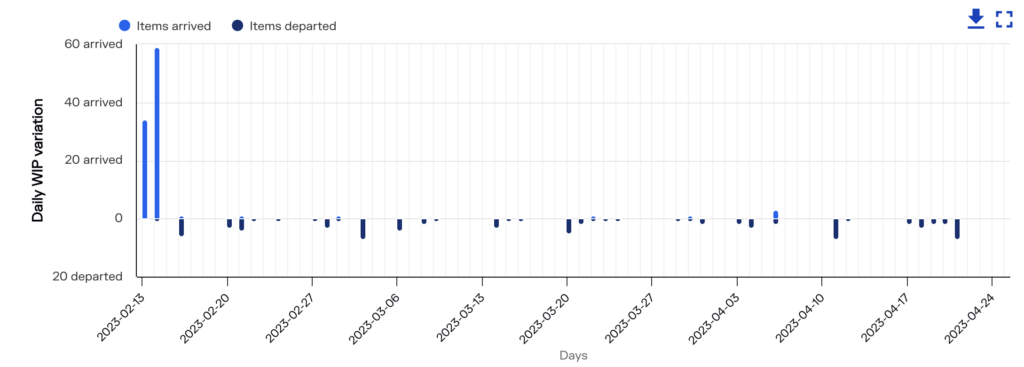
This chart demonstrates how the daily WIP variation can also be used at the product or portfolio level to see how work flows through your board.
Conclusion
The daily WIP variation chart offers precision analysis to see how work enters and leaves your board. It can help you see trends. To learn more, request a free meeting with our team or try Pacemkr for free at https://app.pacemkr.ca