I’ve been teaching the class Professional Scrum with Kanban (PSK) for the last year now and I strongly believe parts of its content will send some of our current practices and books to the Agile museum.
Through the help of the cycle time scatter plot diagram, our decks of poker planning will end up in the Agile museum. Between our actual estimation techniques and the #noestimate movement, I believe the Kanban (or flow) metrics offer a historical perspective based on actual data.
Kanban metrics such as throughput avoid confusion about story points and velocity when we explain these techniques to our customers. I’ve found telling my customer the team completed 4 PBIs is much better than talking velocity. While the book Agile Estimating and Planning by Mike Cohn is a classic, I would now say that some parts are ready to go to the Agile Museum. I would replace it with Daniel Vacanti’s book Actionable Agile – Metrics for predictability.
I’ve looked at the relationship between cycle time and story points for the last 6 years. In 85% of my cases, I get a chart similar to the following one where PBIs of 1, 2, or 3 pts all land in the same cycle time range. In the following chart, I’ve compared the story points of PBIs on the X-axis with their cycle time, from In Progress to Done, on the Y-axis.
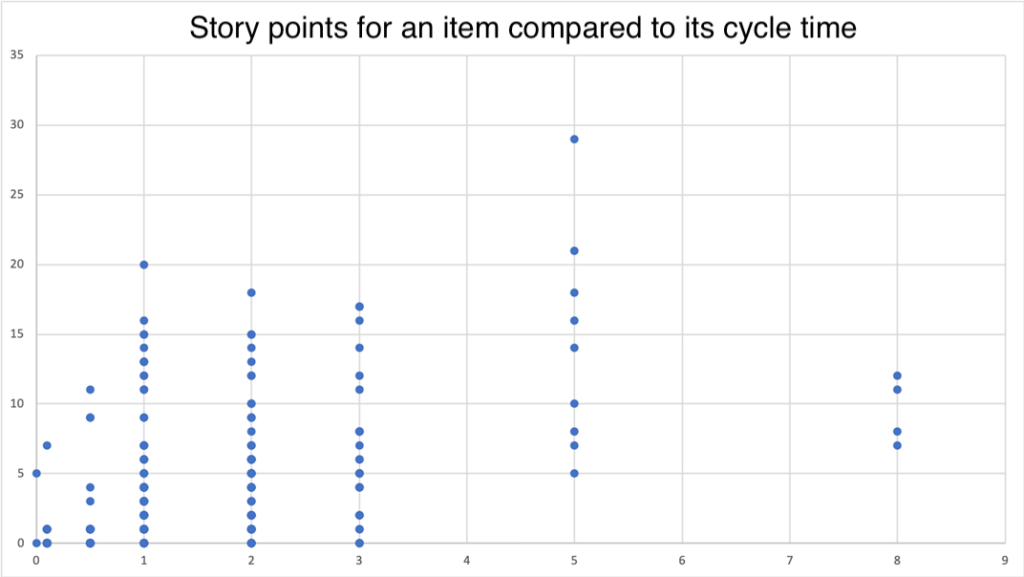
So why waste time arguing between 1, 2, or 3 points when we know historically they will fall in the same range of completion? Is your team in a similar situation?
While we’ve made great leaps forward over the last 20 years in our industry, going from waterfall to an incremental and iterative cycle, I believe it is important to keep in mind the first line of the Agile manifesto:
We are uncovering better ways of developing software by doing it and helping others do it.
www.agilemanifesto.org
Change is hard. It took us 20 years to adopt Agile in our industry. We are now more than ready to stop our eternal conversation about estimations and move forward with historical data as our new way of forecasting our iterations, thus relegating our deck of poker planning cards to the Agile museum.