People often ask what is the recommended percentile when forecasting with Pacemkr. Is it 85%? Or 95%? While the entire conversation/debate about the right percentile is outside the content of this article, let’s take the 85th percentile to see how much data is needed to reach this percentile.
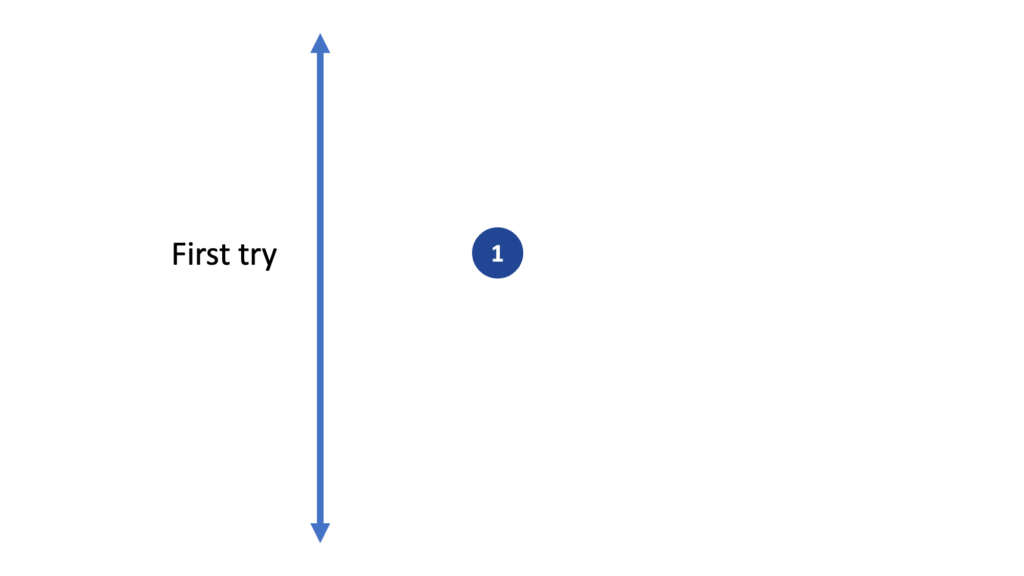
Let’s use a simple example where a ball is picked from a bag to help us understand the amount of data required to reach the 85th percentile. In the image below, the ball is a blue circle with a number one on it. We put it on a line as follows.
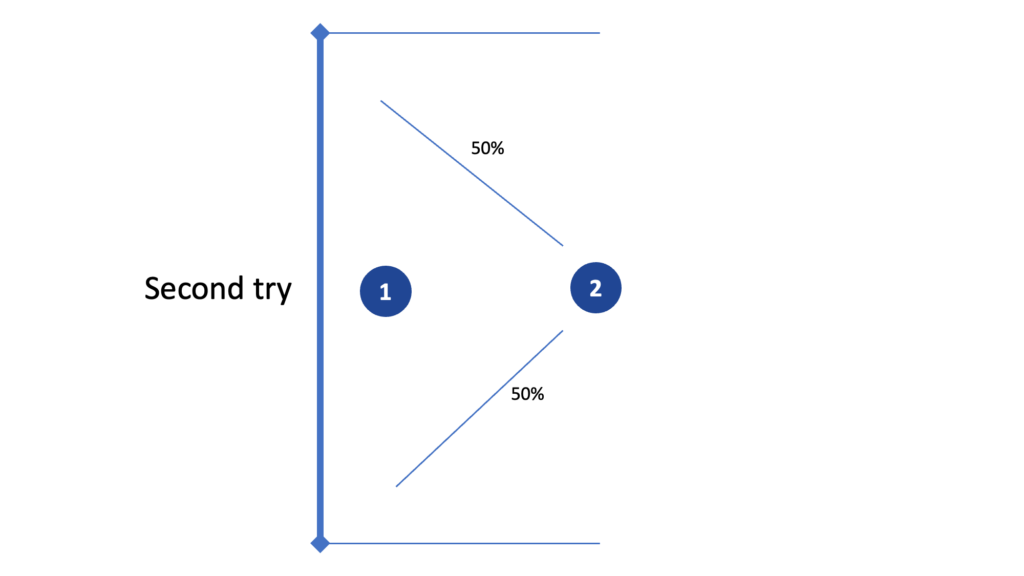
We then pick a second ball from the bag. We have a 50% probability that ball #2 will be above and a 50% probability it will be below ball #1. By above or below, I mean it could be bigger or heavier. In other words, it’s an attribute of comparison with ball #1.
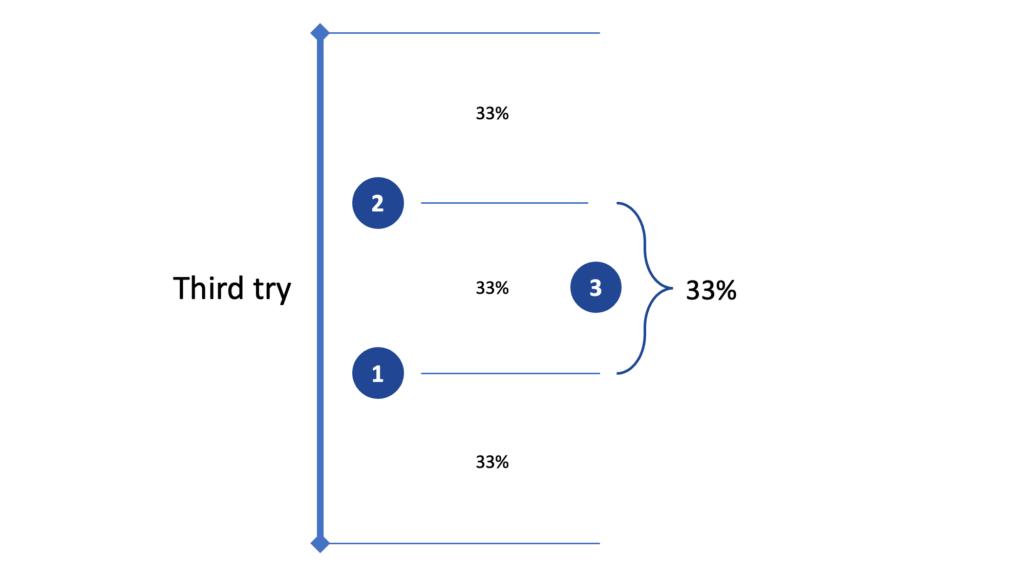
We draw a third ball from the bag. This ball has a 33% probability of being between balls #1 and #2.
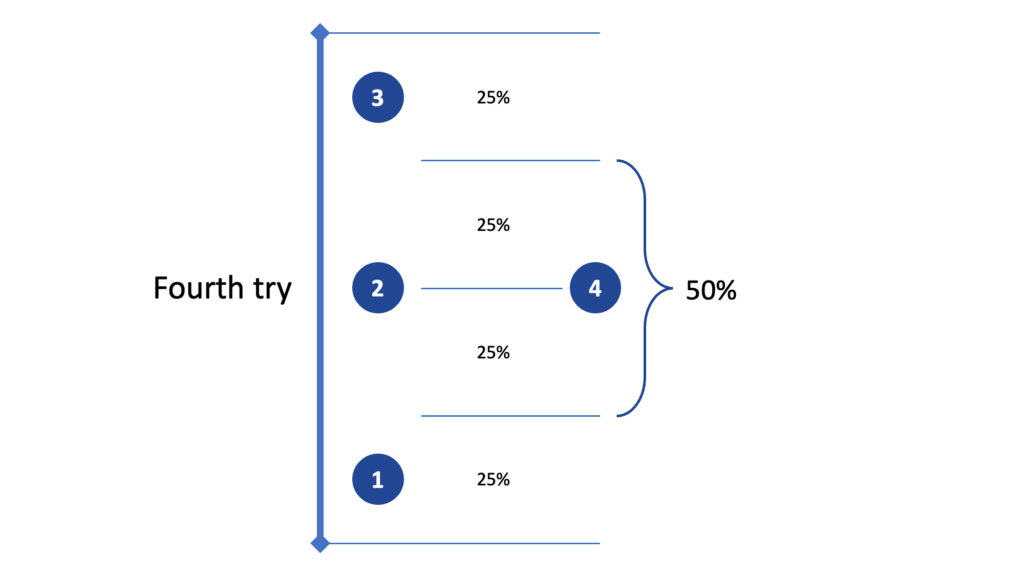
We then draw a fourth ball. It has a 50% probability of being between #1 and #3.
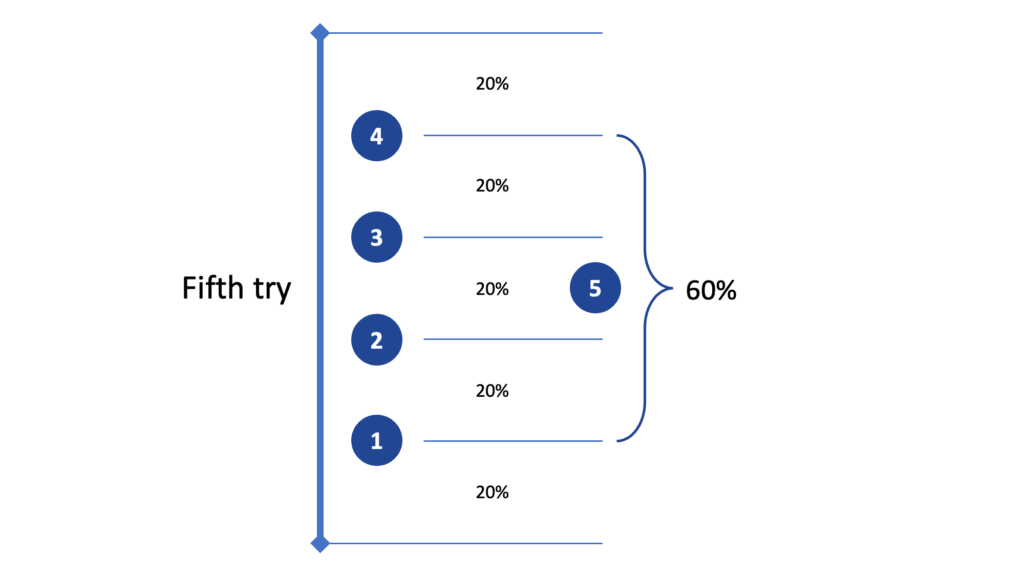
We draw a fifth ball from the bag. Ball #5 has a 60% probability of being between #1 and #4.
We draw a sixth ball from the bag. Ball #6 has a 66.67% probability of being between #1 and #5.
We can summarize the previous images in the following table:
| Number of balls on the line | Probability of landing between the edge cases |
|---|---|
| 2 | 33% |
| 3 | 50% |
| 4 | 60% |
| 5 | 66.7% |
We can extract the following mathematical formula from this example:
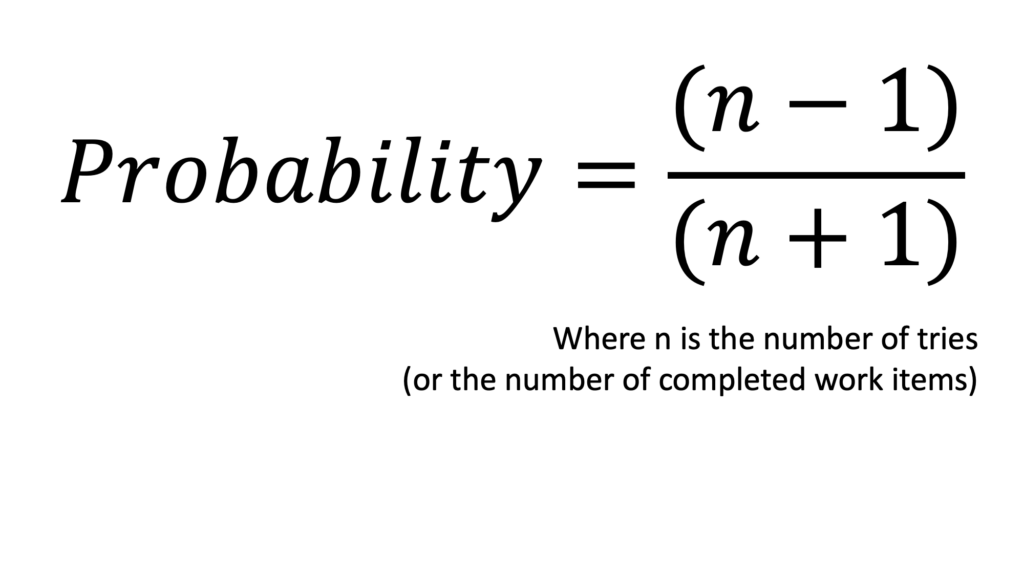
Finally, we can run this formula until we get a probability of hitting our 85% probability.
| Number of balls on the line | Probability of landing between the edge cases |
|---|---|
| 2 | 33% |
| 3 | 50% |
| 4 | 60% |
| 5 | 66.7% |
| 6 | 71% |
| 7 | 75% |
| 8 | 78% |
| 9 | 80.7% |
| 10 | 82% |
| 11 | 83% |
| 12 | 85% |
Once 12 work items are completed, the next work item has an 85% probability of landing between our edge cases, which is the equivalent of our 85th percentile line.
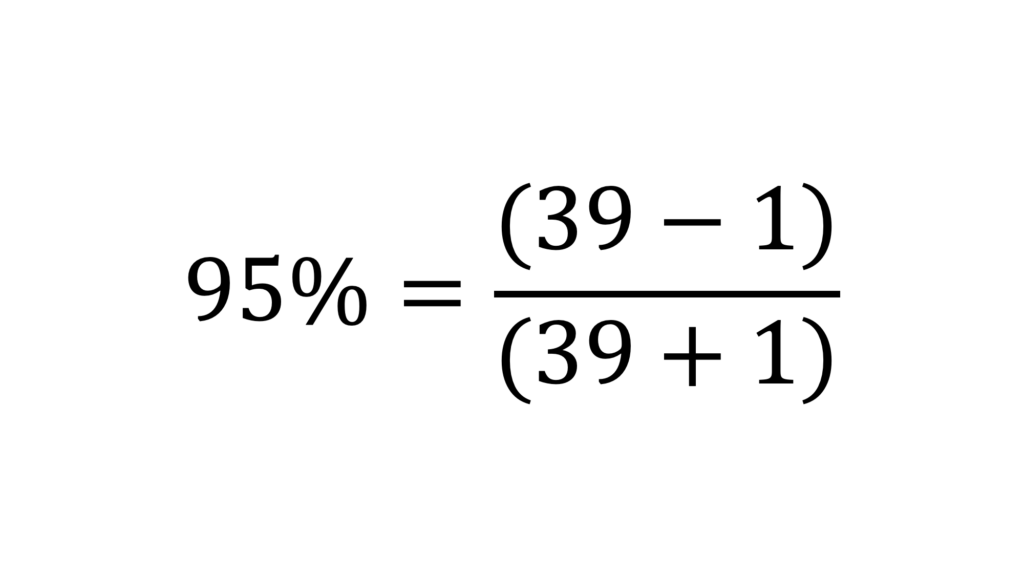
If you wish to get to a 95% confidence level, you need 39 completed work items.
In conclusion, one of the criteria to help you choose the right percentile for your forecast can be the number of data points required to get there. If you are in a team where work items are completed frequently and after a few days, there are already 39 completed work items, the 95th percentile could be a better candidate for your forecasts.
On the other hand, if you are in a slower context where only a few work items are completed every week, maybe the 85th percentile would be a better option knowing it can take months before you reach 39 completed work items.