What is it?
The daily historical Work In Progress (WIP) chart displays the total active work in progress plotted over time. It helps you identify trends or patterns in your work-in-progress. It enables you to visualize the amount of active work your team is doing over time in your workflow.
Before we go any further, it is essential to define the term WIP:
Work In Progress (WIP): The amount of work items that have started but not finished.
Part 1 – Anatomy of the chart
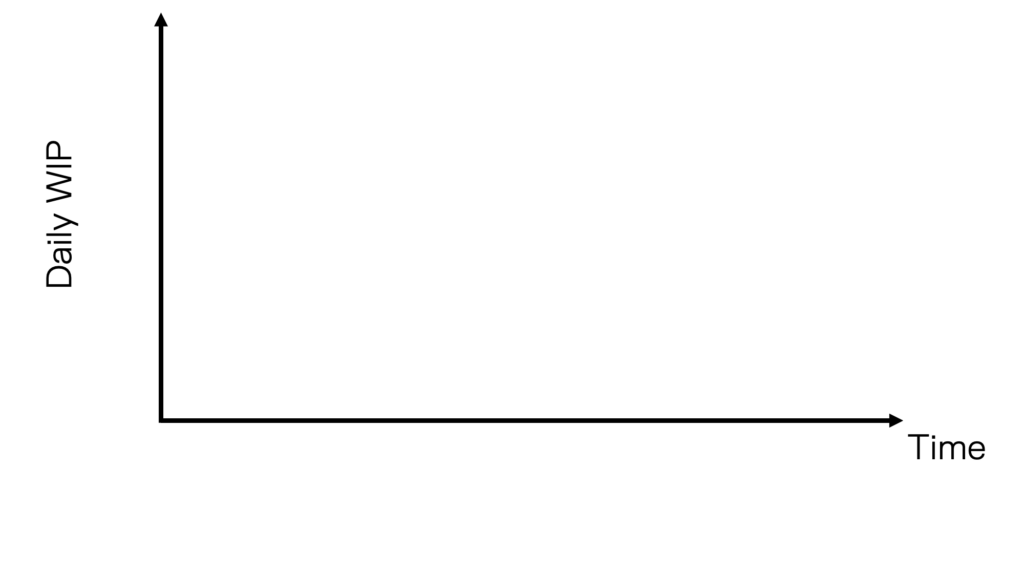
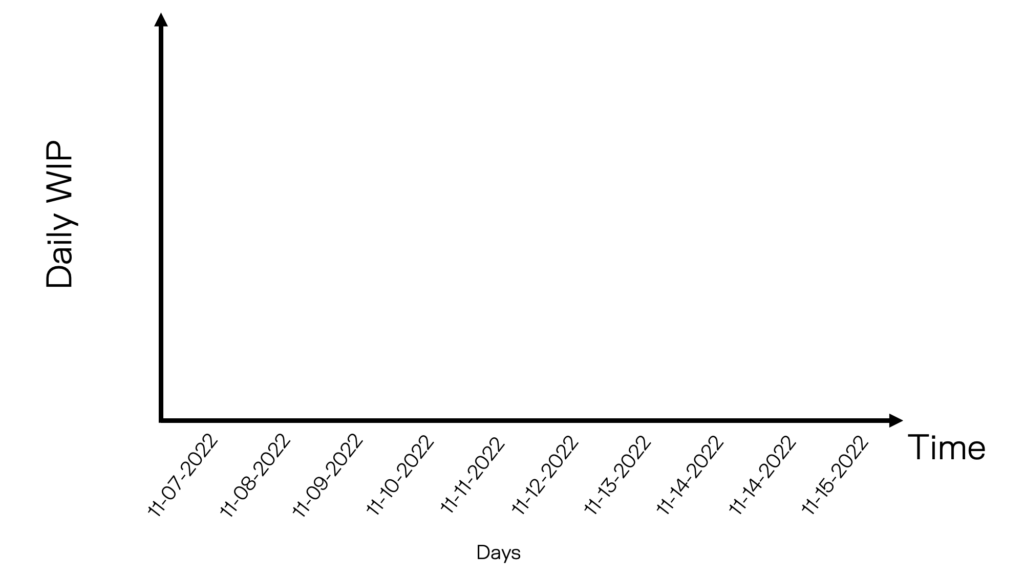
The chart displays the historical work-in-progress data over time. It consists of an X-axis that contains the period on which we want to plot our daily work in progress. The X-axis of the chart always covers a period set in the past. It is always in days. The Y-axis shows the actual number of work items in your process, board, or system.
Visually, an empty daily historical WIP chart plot looks like this:
Our next step is to add a time series on the X-axis. In the following image, we put ten days on the X-axis, from Monday, November 7, 2022, to Wednesday, November 15, 2022.
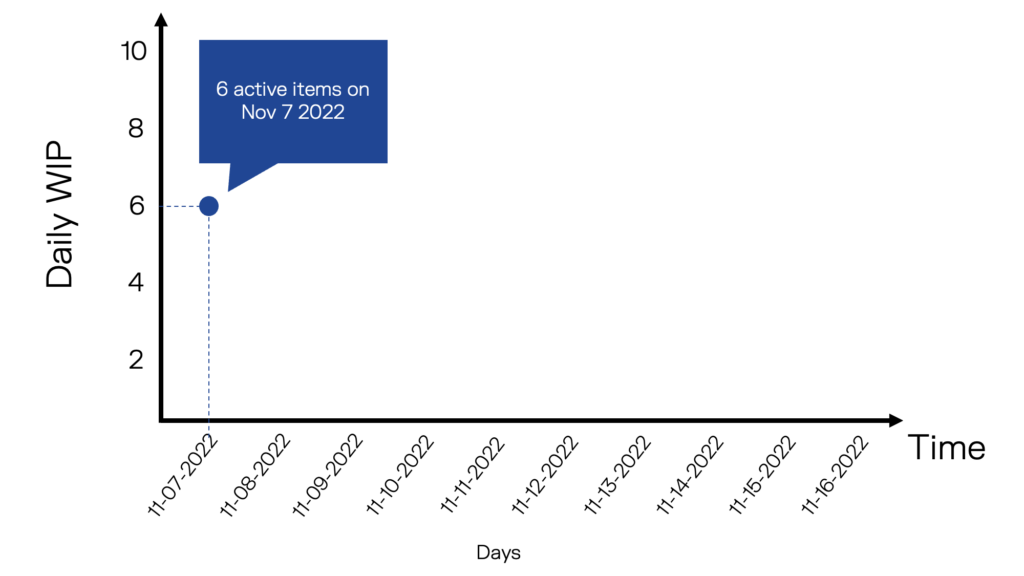
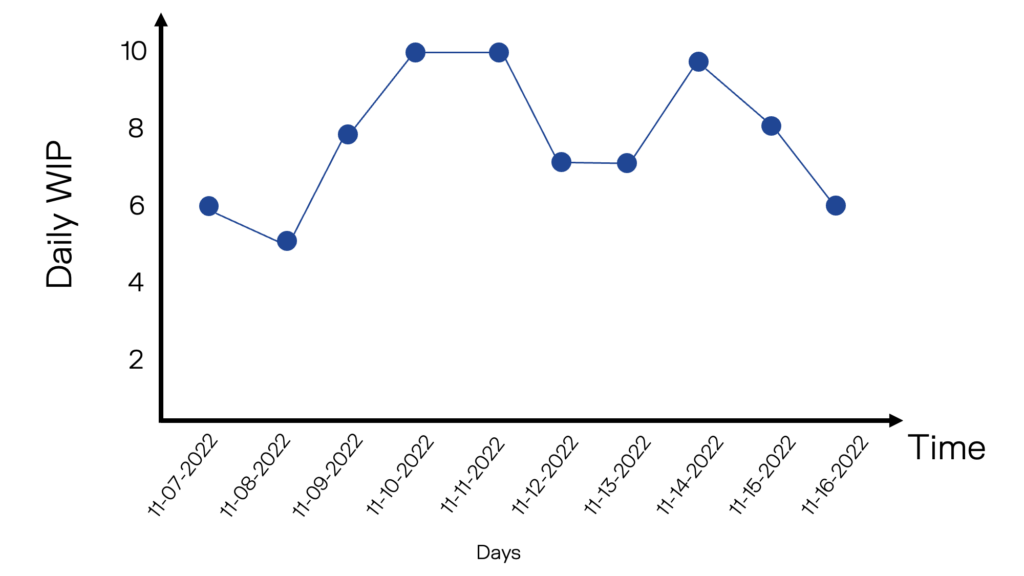
Now that we have a time series on the X-axis, it is time to plot the daily work in progress. In the following image, there were 6 work items in your process on the first Monday.
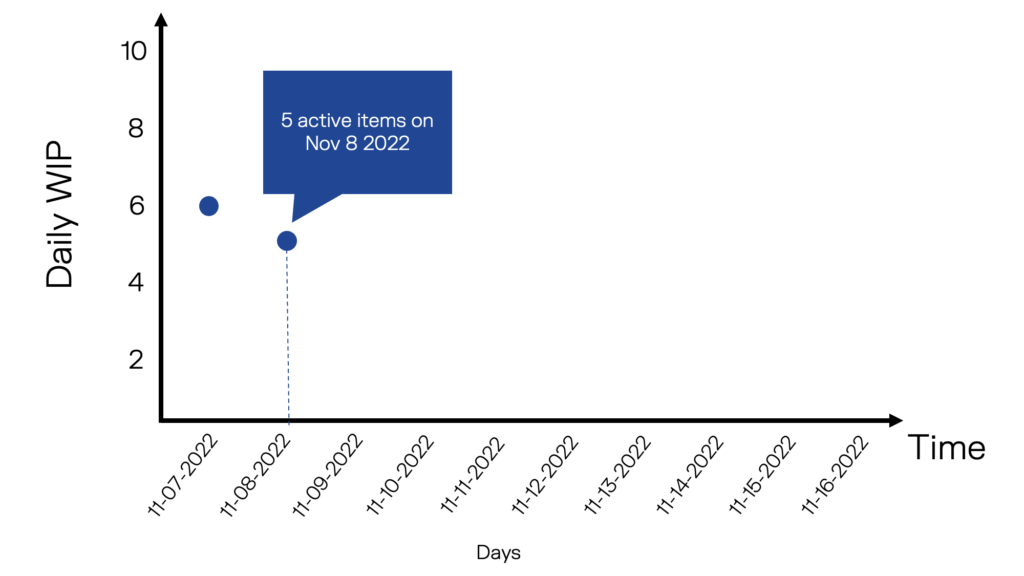
Then, on Tuesday, November 8, 2022, there were 5 active items. The following image shows this additional data point. This means 1 work item was completed on November 8, and no work items were pulled in.
Then, we plot the additional daily WIP on the chart, as shown in the image below. This is our daily historical WIP chart.
Part 2 – What value do you get from this chart?
The daily historical WIP chart visualizes whether teams are accumulating more work in progress (WIP) over time or not. Having a WIP trend that is going down is a good indicator in case you have the same throughput in your system. Lower WIP means lower cycle time, which means that your team is getting faster.
On the other hand, it might be a signal that the team isn’t pulling new work. There are plenty of reasons that might cause this: team members on vacation, holidays, tasks in progress that are too complex and need more time to be completed, etc.
Conclusion
The daily historical WIP is key to actively tracking work in progress. In combination with the WIP Aging and daily WIP variation charts, you have all the tools required to manage your work. Want to learn more? Book a free 30-minute call or try it yourself for free at https://app.pacemkr.ca.