What is it?
The Work in Progress (WIP) Aging chart, sometimes called the Aging chart, displays the age of active work items in your process.
Before we go any further, let’s define the term age of a work item:
Work item age: The amount of elapsed time between when a work item started and the current time.
Kanban guide
Part 1 – Anatomy of the chart
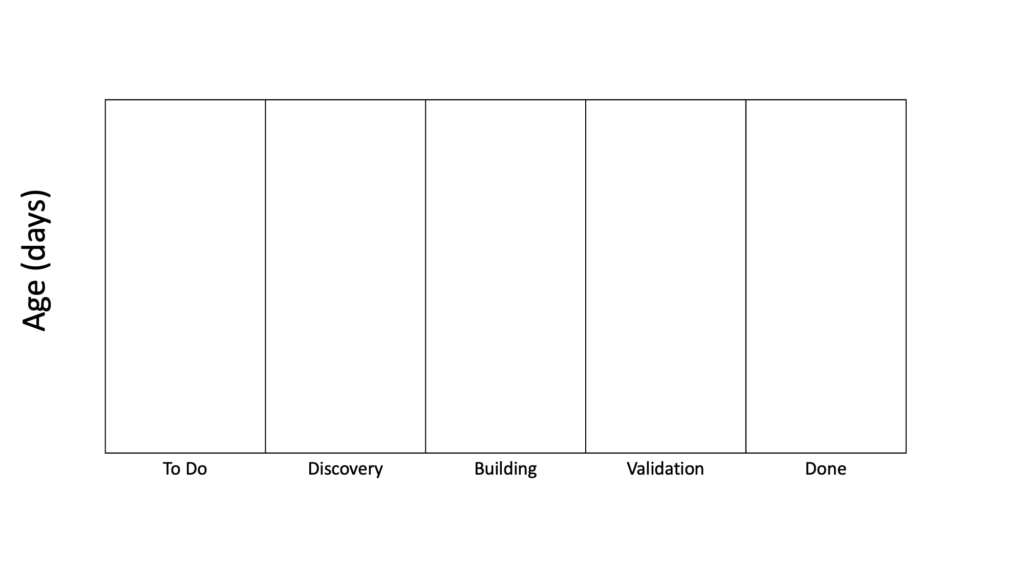
The chart comprises your process’s columns on the X-axis, while the Y-axis displays the work item age. The image below shows the five columns of our process on the X-axis and the age in days on the Y-axis.
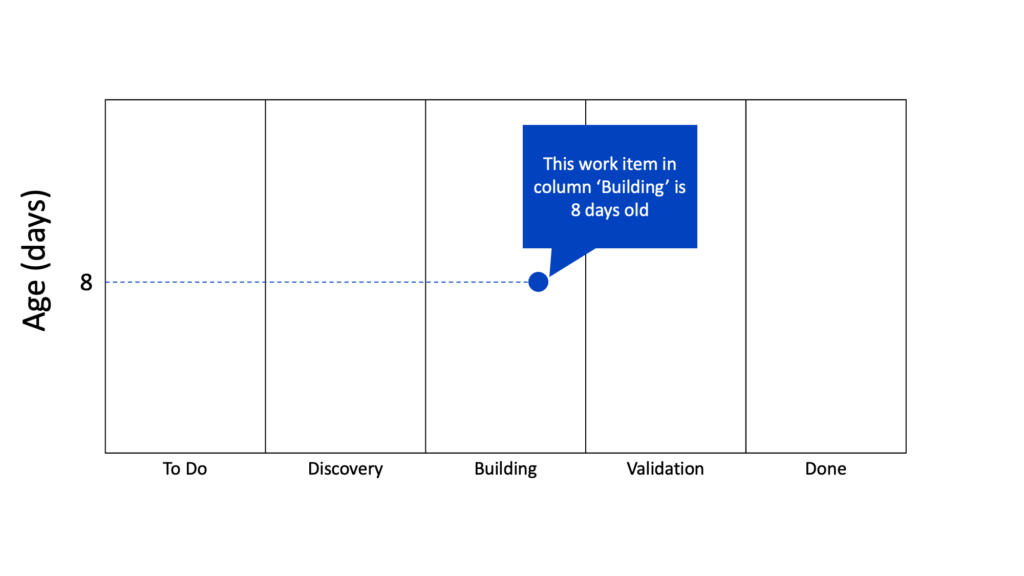
We then plot our active work items on the chart. For example, we have an active eight-day-old work item in the Building column. It is drawn like this on the chart:
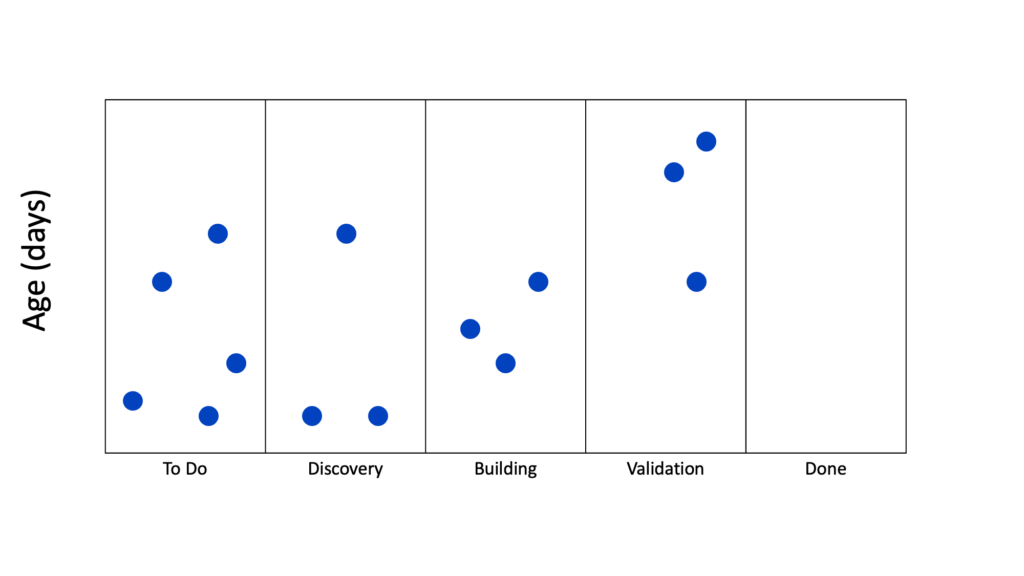
All your active work items are plotted on the chart, as seen in the following image.
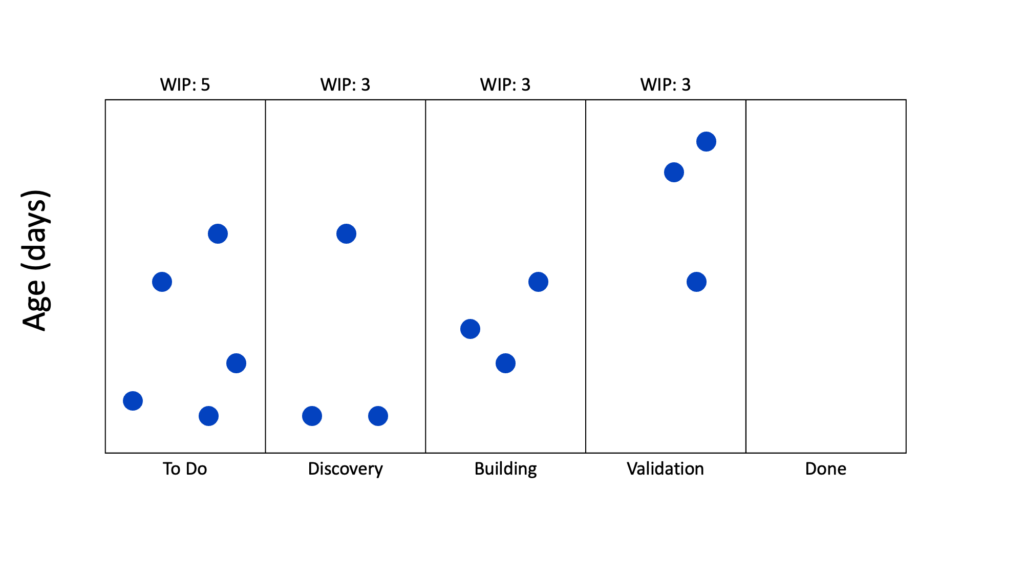
On the top of each column, we add the number of items in each column with the label. For example, the “To Do” column has the label “WIP: 5” at the top to indicate there are 5 work in progress (WIP) in the column.
The final piece of information we need on this chart are the percentiles. Remember how those percentiles were used in the cycle time scatter plot chart to forecast a work item? We carry over those percentile lines against our active work items in the Aging WIP chart.
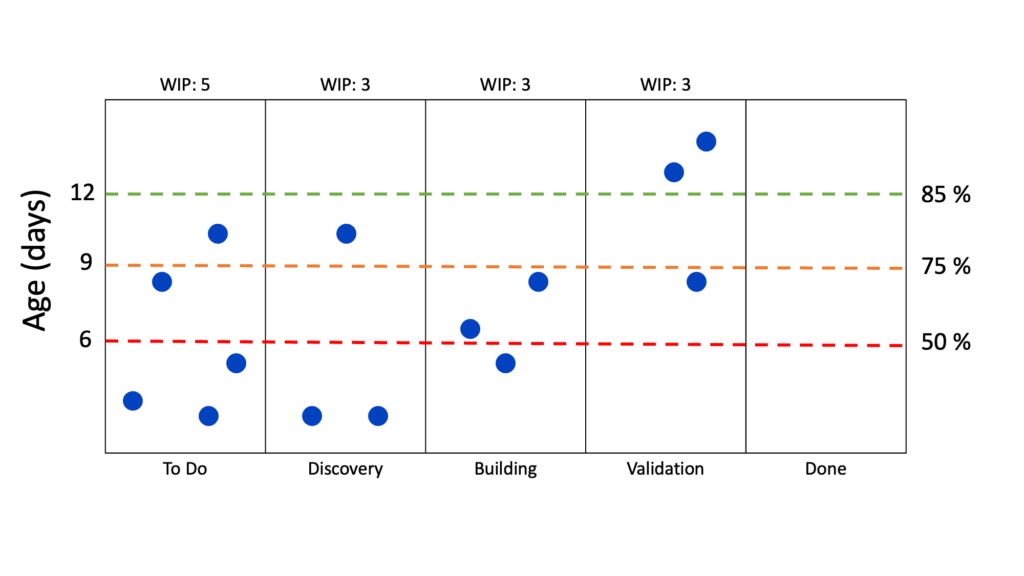
In other words, we track the age of our active work items against our historical completed work items. This tracking helps you have a proper conversation about work items getting too old based on the initial forecast you gave to your customer.
In part 2 of this tutorial, we look at active work items and new questions you can ask about them at your daily standup or daily Scrum.
Part 2 – Looking at an active work item
There are a few ways to start looking at active work items. The first one is to walk the board from right to left.
By doing this, notice how two work items in the “Validation” column are above the 85th percentile line in the image above. This information could indicate they are late and need more attention than, let’s say, the two work items at the bottom of the “Discovery” column.
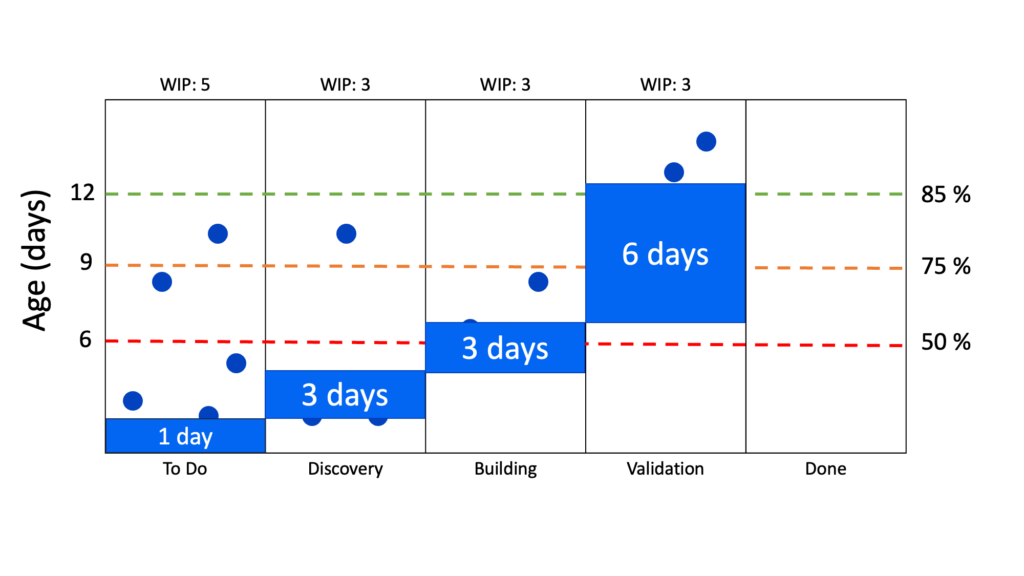
Time spent in each column
By clicking on one of those work items in the “Validation” column, Pacemkr shows the time spent in each column. In the following image, the work item has been in the “Validation” column for 6 days.
Stale work items
Another piece of information the WIP Aging chart can show you is stale items. In other words, work items haven’t moved for a certain period. In the image below, 2 work items are now brown to show they haven’t moved.
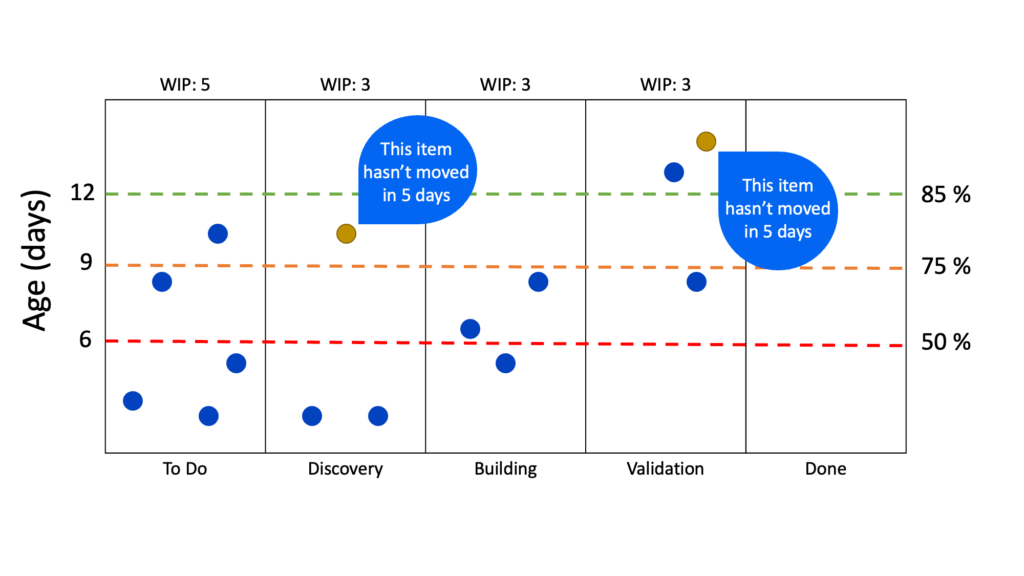
The brown color comes from a banana that hasn’t moved on the counter. After a couple of days, it becomes stale and brown. The same goes for work items that haven’t moved.
To see stale items, look under the WIP Aging chart in Pacemkr for a slider named “Color in brown stale items”
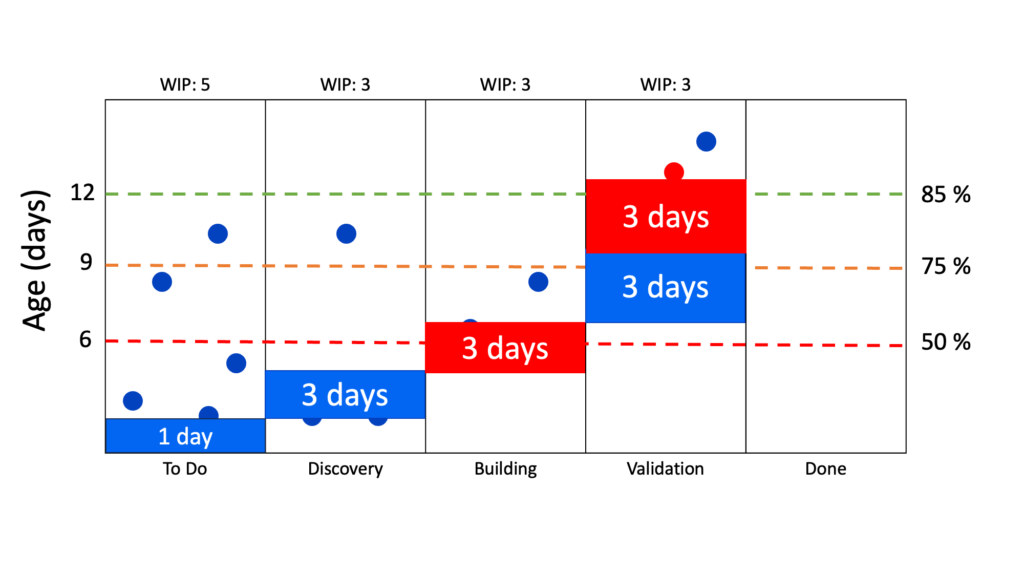
Blocked work items
It is also possible to see blocked work items on the WIP Aging chart. By activating the toggle “Blocked work items” in Pacemkr, it will color work items in red. In the following image, we can see a blocked work item in red in the column “Validation”.

While we could see this item previously and its time spent in each column, we can now see the time blocked in each column. To do so, click on the work item. The following image
Conclusion
The WIP Aging chart is a powerful chart to manage flow at any level of your organization. It empowers your teams with insights beyond data.