The Forecasting section in Pacemkr generates forecasts based on your historical throughput. Once you’ve selected the throughputs in your throughput run chart, the Forecasting module will feed this data into its simulator to generate forecasts.
Configuring your forecasts
Pacemkr has a set of controls to configure your forecasts based on your context.
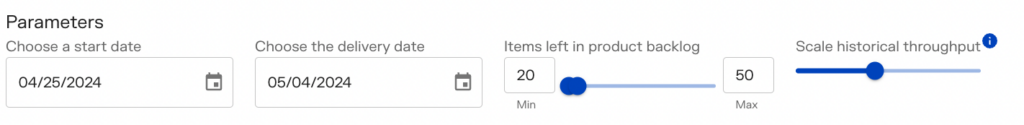
Start date
Set your project’s start date. This value can be when you input the data (today) or when you believe your project will start.
Delivery Date
Set your project’s delivery date. This value cannot be in the past as Pacemkr wants to forecast a delivery date in the future.
Note that the delivery date can never be before or on the same day as the start date.
Items left in the product backlog
Set these values based on the number of items to deliver in your project/release.
As this field is a slider, you can indicate a range of items using both thumbs (aka the blue dots on the slider) to the desired values. If you have a specific number of items, move both thumbs on the same value. You can also use the textboxes on either side to set your values.
Scale Historical Throughput
This parameter is used to scale your team’s historical throughput, which will help your forecasting.
For example, let’s say you have three new full-time members starting in your team tomorrow. This change will impact your team’s future throughput by accelerating your team’s productivity. Your historical throughput might be between 2 and 4 completed items per week. But with three new team members, you might forecast a 20% increase in throughput.
Forecasts
Pacemkr is built on the premise that a forecast is always a set of probable values. The app generates dates and item forecasts and offers four scenarios with different pre-configured probabilities.
Each time you adjust one of the parameters described in the section above, or you change one of the filters, Pacemkr recalculates its forecasts.
Pacemkr creates 2 types of forecasts:
- How many items will be done for a chosen date?
- What are the potential delivery dates for when a certain amount of items is specified?
Forecasting items to be delivered on a chosen date
In this result panel, Pacemkr displays how many items can be delivered for a chosen date. In the following image, Pacemkr forecasts that for April 29, 2024, there’s a 90% level of confidence that 15 items will be delivered.
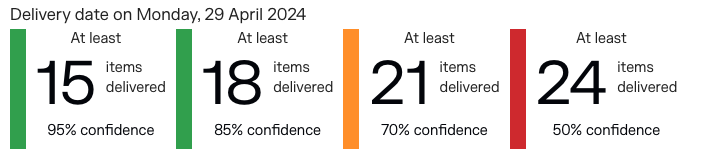
As the level of confidence lowers, the number of items forecasted increases.
Forecasting dates based on the number of items specified
The user can specify how many items are remaining in his product backlog, queue, or to-do list, and based on his team’s productivity, Pacemkr will generate potential delivery dates.
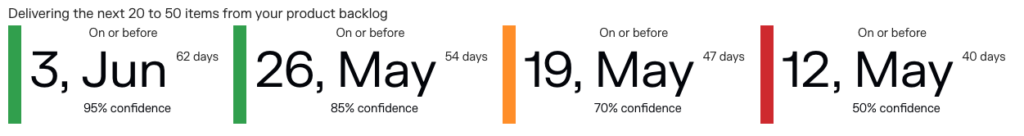
Reading these forecasts is a bit different than reading the forecasted dates. When we read “3, June, 62 days or less with 95% confidence,” it means Pacemkr forecasts your team can deliver between 20 and 50 items either on 3, June or before that date.
At the other end of this image, Pace,kr says there’s a 50% chance the team can deliver between 20 and 50 items either by 12 May or before that date. As you decrease your confidence level, you get a date closer to today. There is less confidence that your team can deliver the number of specified items.