To upload an Excel file into Pacemkr, it has to follow a specific format. This tutorial guides you to make sure your Excel file will be understood by Pacemkr. To follow along, you can download this sample Excel spreadsheet.
Organization of the file
The file first line is always the definition of the columns. It helps Pacemkr were to find its information and it helps you structure your data in a simple and easy way.
These columns are grouped into three categories:
- Information about the work item
- Dates the work item in the workflow
- Properties of the work item
Information about the work item
To identify a work item, the following 3 columns are available:
| Title | Description |
|---|---|
| ID | The unique identifier of your product backlog item |
| Link (optional) | A URL of the product backlog item in your tracking software (if you have one) |
| Title | The summary, title or name of the product backlog item |
Dates of the work item in the workflow
After these first 3 columns, you then add the columns of your workflow. Suppose we have the following workflow:

Then you would have the following columns in the spreadsheet:
| ID | Link | Title | Backlog | Development | Testing | Done |
|---|---|---|---|---|---|---|
| 0001 | Url | Item #2 | 2024/10/15 | 2024/10/17 | 2024/10/20 | 2024/10/25 |
| 0002 | Url | Item #2 | 2024/10/17 | 2024/10/20 |
As for the values in these columns, you put the date at which your work item entered each column, leaving it blank for columns it didn’t go into or hasn’t gone into yet.
The dates should not include the time. At this time, Pacemkr only supports dates.
Pacemkr supports the following date formats as well as the ‘-‘ or ‘/’ separator
- YYYYMMDD
- YYYYDDMM
- DDMMYYYY
- MMDDYYYY
Properties of the work item
After the workflow columns, you can add additional columns that will be used as filters. They are called the ‘property’ columns. Here are a couple of well-known and used filters:
| Name | Description |
|---|---|
| Priority | Filter by the types of priorities you have |
| Type | You can have the opportunity to filter on a specific PBI type. |
| Effort | If your Scrum team is pointing your stories, you can add the estimation value here. In another post, I will explain how to compare the effort versus the actual cycle time. |
Once your Excel spreadsheet is ready, you can load it in the Excel wizard
Extra features
While the content of the Excel file is much more limited than an project management software, there are a few extra features Pacemkr supports to aliviate the fact that this is a spreadsheet
Handling of multiple values
When extracting the data from an external source, it is possible that a list of values are saved within a single cell.
For example, if a work item has 3 labels (‘ABC’, ‘XYZ’ and ‘DEF’), they can be exported into a single cell as ABC,XYZ,DEF.
As you probably want to filter on each of these labels, you have to inform Pacemkr of this. To do so, add the suffix (m) at the end of the column title. In the following example, this is demonstrated with column ‘Labels’ which has the suffix (m).
| ID | Link | Title | Backlog | Development | Testing | Done | Labels(m) |
|---|---|---|---|---|---|---|---|
| 0001 | Url | Item #2 | 2024/10/15 | 2024/10/17 | 2024/10/20 | 2024/10/25 | ABC,DEF |
| 0002 | Url | Item #2 | 2024/10/17 | 2024/10/20 |
Once loaded in Pacemkr, there will be two filters for the Labels property: ABC and DEF.
Troubleshooting
This section covers potential errors you may encounter with your Excel file. It helps you understand the problem and how to solve it.
No column named “Title”
As explained above in the tutorial, Pacemkr needs the column “Ttitle” to discover where the workflow starts. If this column is missing, Pacemkr shows the following message in the wizard screen.
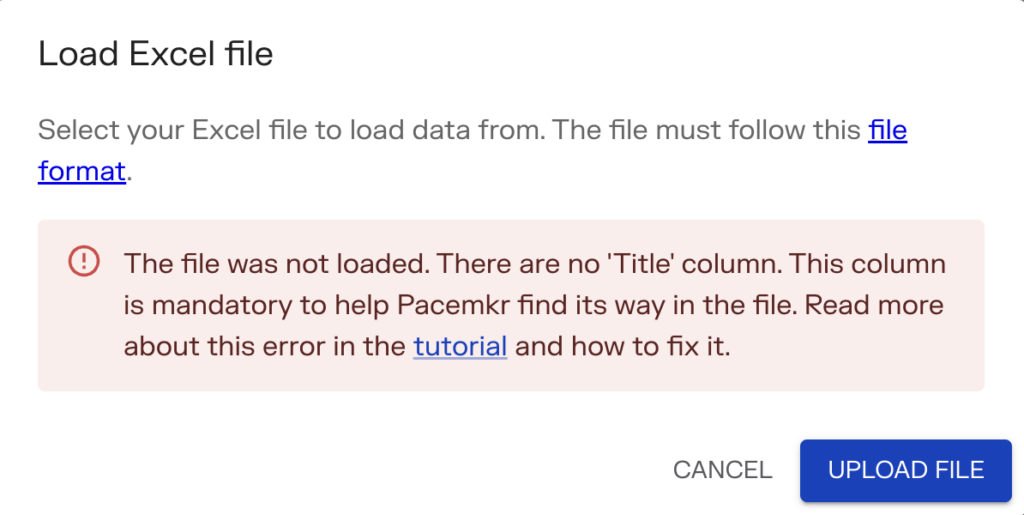
You can correct and save the file before reloading it by pressing the Upload file.
Invalid lines
As Pacemkr loads the file, it can detect errors on specific lines. Pacemkr let’s you know these errors as shown in the following screen shot.
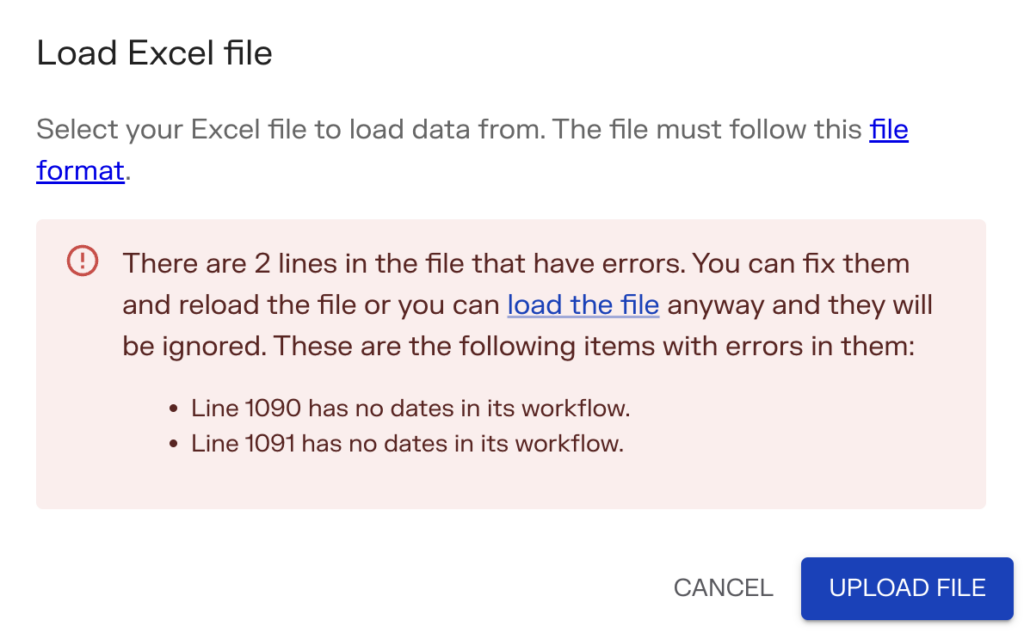
You can correct those lines before in your file and press the button ‘Upload file’ to reload the file. If you don’t mind the errors found in the file, you can click the link ‘load the file’ in the error message. Pacemkr will ignores those lines in his calculations.